

Where in the World Would You Want to Live? 20 Years of World Bank Data
What makes a country a good place to live, and can economic data tell us? In my first Udacity Data Science project, I explored more than 20 years of World Bank development data to find out.
Project at a glance
- Course: Udacity Data Science Nanodegree, Project 1
- Data: World Bank World Development Indicators, 2000–2023
- Process: CRISP-DM, from business understanding to modeling
- Tools: Python, pandas, NumPy, Matplotlib, seaborn, scikit-learn
The questions
The project looks at global growth, investment, livability and the human cost of economic crises through five questions:
- Which countries have grown richest since 2000?
- Where is the relationship between investment and economic growth strongest?
- Which countries offer the best combination of income, life expectancy and low inequality?
- How did the 2008 financial crisis and COVID-19 affect growth and employment?
- Can a machine learning model predict life expectancy from economic indicators?
How I approached it
The raw World Bank export stores every year as its own column. I reshaped it from wide to long format (one row per country, indicator and year), removed regional aggregates so that only the 220 actual countries remained, and limited the analysis to 2000–2023.
Missing values were the biggest challenge. Instead of one global rule, each question uses only the indicators it needs and drops incomplete rows for exactly those. The Gini index, for example, is missing for 73% of country-years, so the livability ranking covers 165 countries. The trade-off: countries with weaker statistical reporting are under-represented in the results.
Key findings
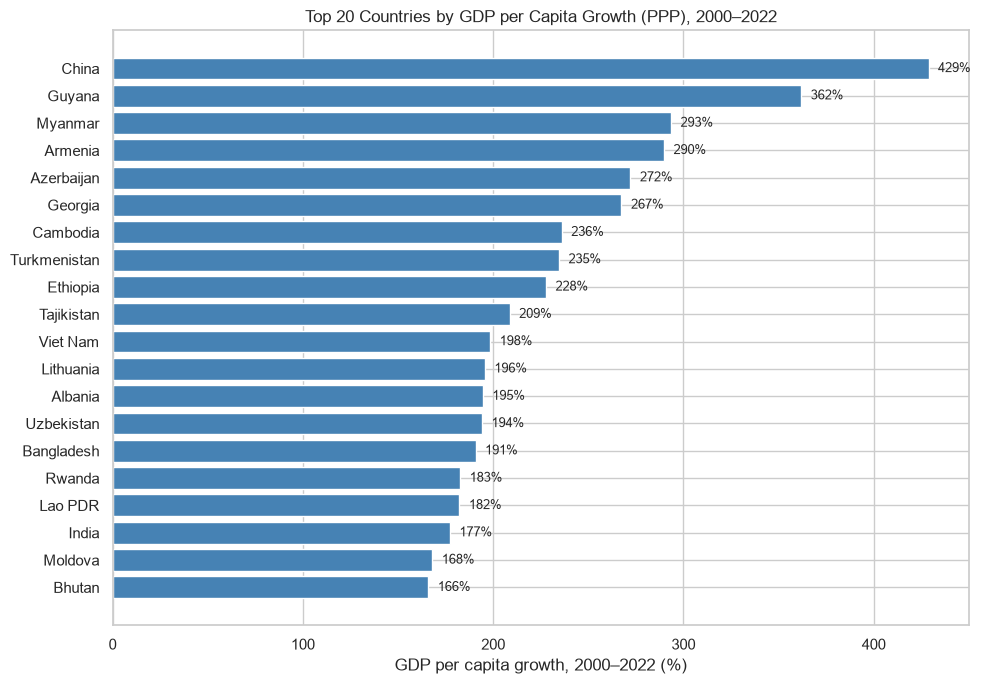
1. China grew richest by far
Between 2000 and 2022, China’s GDP per capita (PPP) rose by 429%, from $4,066 to $21,499, far ahead of every other country.
2. Investment and growth are only loosely linked
Across all countries, investment (gross capital formation) and GDP growth show only a weak positive correlation (r = 0.189). The link is strongest in Mongolia (r = 0.760), where capital investment tracks growth most consistently.
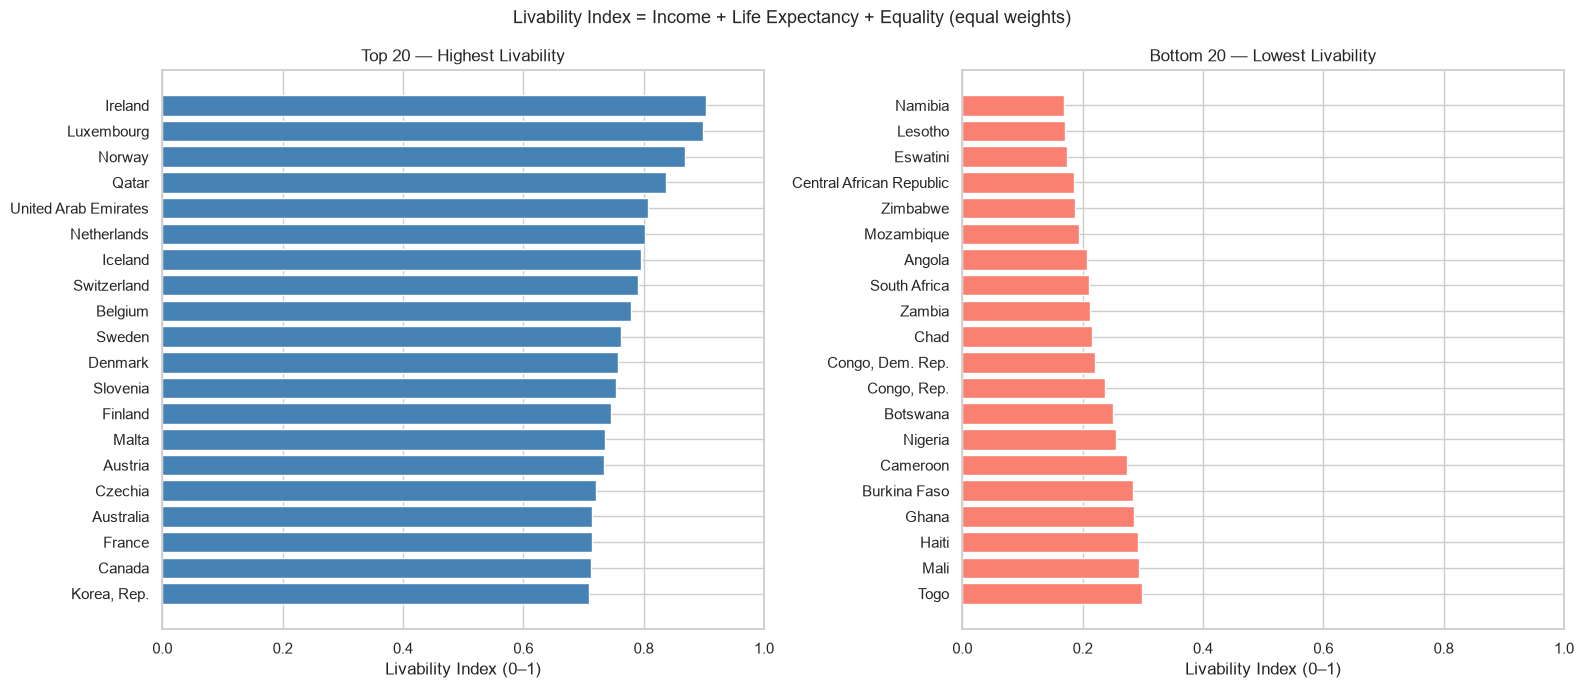
3. Ireland tops the livability index
A simple composite index combining income, life expectancy and income equality (equal weights) ranks Ireland first with a score of 0.904 out of 1.0. Namibia scores lowest at 0.169.
4. COVID-19 hit harder than the financial crisis
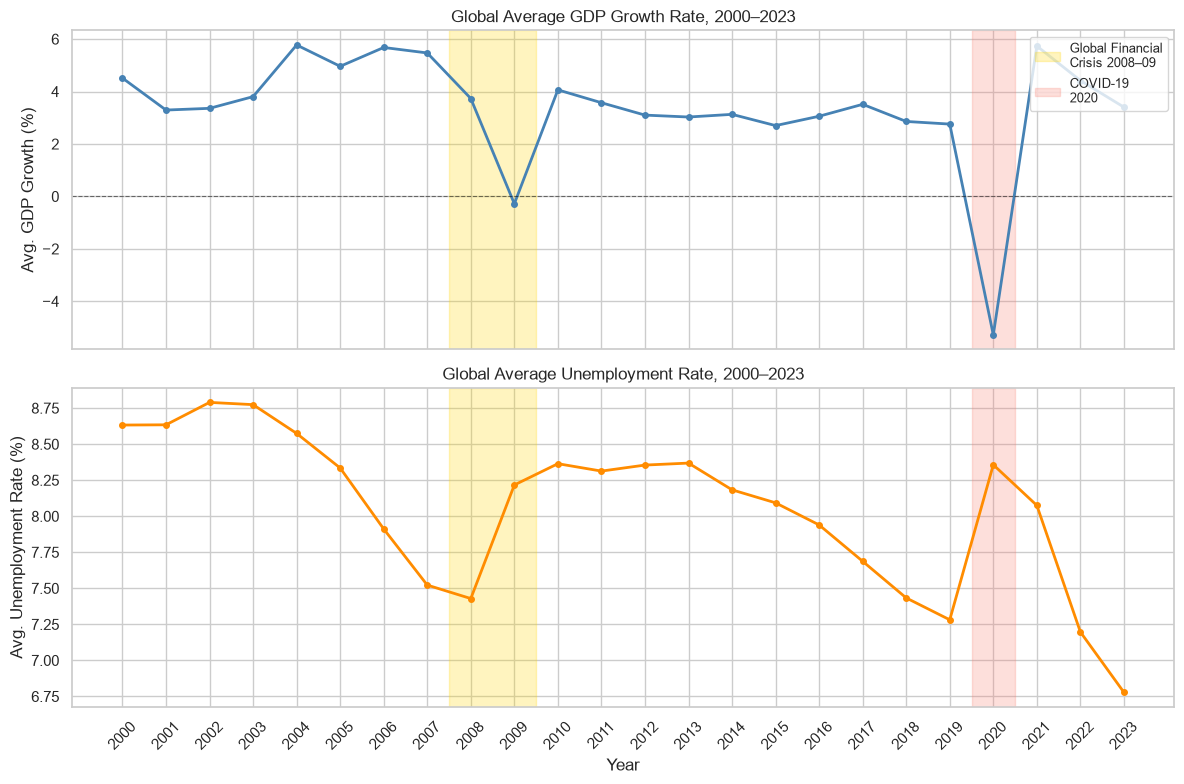
World average GDP growth fell by about 8 percentage points in 2020, from +2.8% to −5.3%. The 2008 financial crisis caused a drop of about 4 points, to −0.3% in 2009. The rebound followed quickly, with +5.7% in 2021.
5. Health spending is the strongest predictor of life expectancy
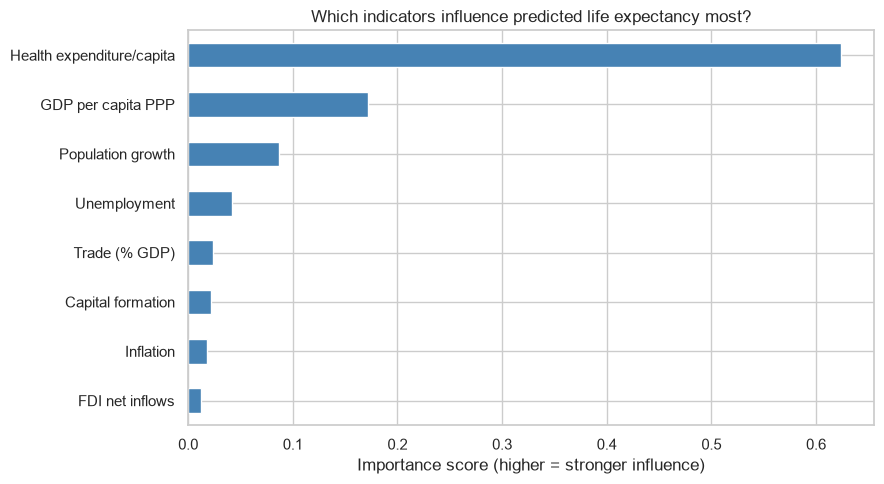
A linear regression baseline reached an R² of 0.600 with an average error of 4.09 years. A Random Forest model did much better: R² = 0.922 with a mean error of 1.46 years on the test set. Health expenditure per capita turned out to be the most important feature by a wide margin.
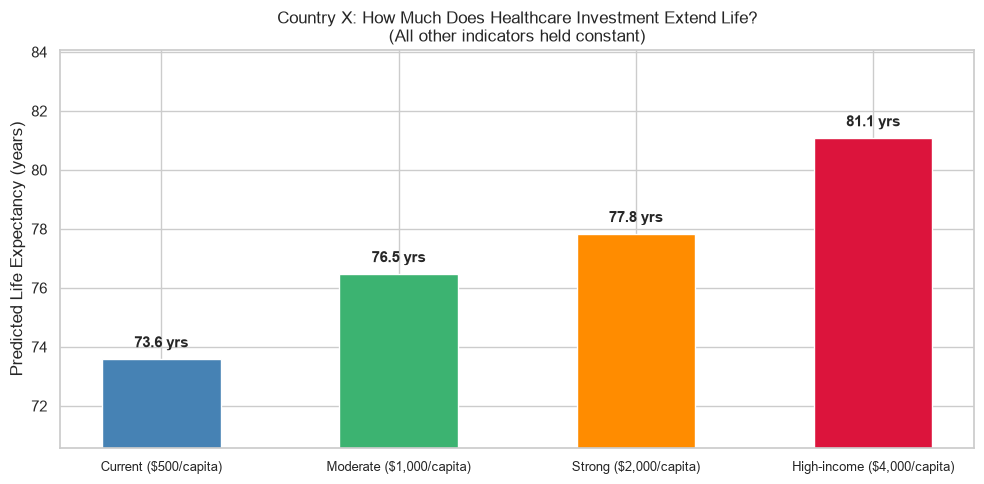
To make this tangible, I asked the model about a hypothetical middle-income country: raising healthcare spending from $500 to $4,000 per capita, with everything else unchanged, increases predicted life expectancy from 73.6 to 81.1 years, a gain of 7.5 years. This is a model scenario, not a causal claim.
What I learned
- Data preparation is most of the work. Reshaping the data and deciding how to handle missing values had to happen before any chart or model made sense.
- Missing data shapes the answer. Every dropped row changes which countries are in the results, so documenting those decisions is part of the analysis.
- Always compare against a baseline. The linear regression made it clear how much the Random Forest actually adds.
- One test score is not the whole story. 5-fold cross-validation gave a lower R² of 0.725 ± 0.059, a reminder that results depend on how the data is split.
Data source: World Bank, World Development Indicators, licensed under CC BY 4.0. Parts of this page were written with the help of AI tools and reviewed by me.